How to Visualize Data with AI: A Practical Guide for Modern Workflows
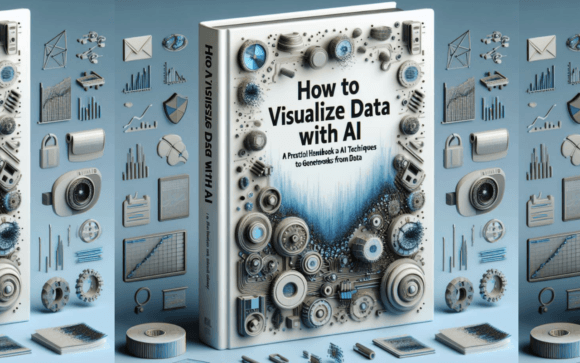
The integration of artificial intelligence into data visualization marks a significant shift from conventional charting tools to a more expressive, creative, and efficient process. The book How to Visualize Data with AI: A Practical Handbook for Using AI Techniques to Generate Artworks from Data serves as a focused guide for professionals and creators looking to harness this shift. It moves beyond the theory of AI art to provide actionable methods for embedding AI-driven visualization into real projects, from initial data exploration to final presentation.
Where AI Visualization Fits in Your Process
Whether you are analyzing quarterly sales figures, preparing an educational module, or developing a marketing campaign, data visualization is rarely an isolated task. It is a step within a broader workflow that includes data collection, analysis, insight generation, and communication. Traditional tools like spreadsheet graphs or dedicated BI platforms handle the analytical phase well. However, the communication phase—where you need to engage, persuade, or inspire—often requires a more creative leap. This is the precise gap that AI visualization techniques fill.
Consider a common scenario: you have a complex dataset about customer behavior. Standard charts reveal the trends, but they fail to capture the emotional narrative or conceptual themes behind the numbers. By applying AI techniques like text-to-image generation or artistic style transfer, you can create a supplementary visual layer. This layer translates abstract metrics into concrete, memorable imagery that resonates with different audiences. Therefore, AI visualization acts as a powerful complement, not a replacement, to your existing analytical toolkit. It is used after the core analysis to enhance the output and before the final delivery to refine the message.
Key Techniques and Their Practical Applications
The handbook details several core AI methods, each with distinct use cases fitting different stages of a project.
Generative Image Creation from Text Prompts
Tools like DALL-E 3 allow you to describe a data-driven concept in words and receive a corresponding image. For instance, after analyzing urban traffic flow data, you could prompt the AI to generate “a surreal painting of cars flowing like a river through a city at night.” This image could then become the centerpiece of a public awareness campaign. The practical implementation requires careful prompt engineering. You must learn to distill your data insights into concise, evocative descriptions, often iterating several times to align the AI’s output with your intended message.
AI-Enhanced Infographics and Information Design
Infographics blend data with design. AI can accelerate this process by suggesting layouts, generating icon sets based on your topics, or colorizing charts in aesthetically harmonious palettes. In a business workflow, you might use an AI tool to quickly produce multiple infographic style options for a report, allowing for rapid client feedback and iteration. This improves efficiency and consistency, as the AI can apply the same stylistic rules across a series of related visuals.
Interactive Visualization with AI Backends
Moving beyond static images, AI can power interactive experiences. By training a simple model on your dataset, you could create an interface where users input parameters (like “show me scenarios for 10% growth”) and the AI dynamically generates a visual representation of that scenario. This is particularly valuable for educators and consultants facilitating exploratory learning or decision-making sessions. It shifts visualization from a presentation tool to a collaborative discovery tool.
Artistic Style Transfer for Brand Alignment
This technique applies the visual style of one image (e.g., a company’s brand artwork, a famous painting) to another image (e.g., a standard bar chart). For marketers and publishers, this ensures that all data visuals maintain a consistent brand identity. The workflow involves preparing your base chart and your style reference image, then using an AI service to merge them. Quality control is key; you must check that the transfer enhances readability rather than obscuring it.
Integrating AI Visualization into Your Routine
Adopting these techniques smoothly requires some preparation and organizational thought.
Start with a Clear Objective: Before opening an AI tool, define what you want the visualization to achieve. Is it to surprise, to explain, to compare, or to propose? This objective will guide your choice of technique and your evaluation of the outputs.
Prepare Your Data Narrative: AI visualization is not about feeding raw CSV files into a model. It’s about translating the story your data tells. Summarize your key insights, themes, and emotions in plain language first. This narrative becomes the feedstock for your prompts and concepts.
Iterate and Refine: Treat AI generation as an iterative draft process. Your first output is a starting point. Use it, critique it, and refine your approach. Perhaps combine multiple AI outputs in a traditional design tool like Canva or Adobe Illustrator for final polishing.
Consider Ethics and Transparency: When presenting AI-generated data art, especially in professional or scientific contexts, it may be appropriate to briefly disclose the method. This maintains trust and encourages discussions about interpretation.
Real-World Use Cases Across Domains
The applicability of How to Visualize Data with AI spans numerous fields, fitting into existing professional routines.
- Education: Teachers creating lesson materials can transform historical statistics into evocative period artworks, helping students connect emotionally with the past. The process happens after selecting the curriculum data and before the classroom delivery.
- Business & Entrepreneurship: Startup founders can use conceptual AI artworks to visualize market landscapes or competitive pressures in investor pitches, adding a compelling layer beyond traditional slides.
- Science & Research: Researchers can employ style transfer to give complex genomic charts a consistent, publication-ready aesthetic, saving design time while maintaining academic rigor.
- Blogging & Content Creation: Bloggers can quickly generate unique featured images for posts about data trends, enhancing SEO with original visuals and improving reader engagement.
- Personal Projects & Hobbies: Hobbyists tracking personal fitness or financial data can celebrate milestones by generating personalized artistic representations, integrating the practice into a regular review routine.
Long-Term Value and Skill Development
Learning to visualize data with AI is not a one-off project skill. It develops a new competency in creative data communication. As you practice, you build a library of prompts, styles, and workflows that can be adapted to future projects, increasing your long-term efficiency. The handbook encourages this development by providing structured projects that scale in complexity. Furthermore, the outputs you create become reusable assets. A well-crafted AI visualization for a client report can serve as a template or inspiration for future work with similar data themes, ensuring consistency and quality over time.
Ultimately, the book positions AI as a collaborative partner in the visualization workflow. It handles the heavy lifting of generative design, allowing you to focus on the higher-order tasks of narrative construction, audience analysis, and strategic communication. By following its practical guidance, you can move from simply showing data to truly storytelling with data, making your insights not only clear but also captivating and memorable.